TREEMAP
A dataset to help firefighters develop strategies and tactics, and stay safe
BY KARIN RILEY, WITH MARK FINNEY AND ISAAC GRENFELL

I’m the lead researcher on a project called TreeMap. When I give presentations about TreeMap, I often ask participants, “If you had a map showing the size and species of every tree in the continental United States, what would you do with it?” Here are some of the answers I’ve heard:
- calculate number of live and dead trees in each state and National Forest
- select areas for fuel treatment and estimate the thinning volume and revenues
- apply thinning prescriptions and see how they would change fire behavior and likelihood
- see the effect of prescribed fire and fuel treatment on stream runoff.
You can explore tradeoffs between timber harvest and fuel management. You can make a map of snag density and height for use during active fire incidents, so that firefighting personnel could avoid traveling and building lines through high-risk areas. One fire captain who used TreeMap in the summer of 2021 wrote, “the Snag Hazard map proved a valuable tool when interfacing with IMT Safety and Operations. A picture is definitely worth a thousand words.”
If you happen to be someone who enjoys computational fluid dynamics modeling, you might use TreeMap to help satiate your curiosity about how flames might or might not travel from tree to tree. By making some assumptions about crown structure and tree locations, you can generate 3D renderings of forests and aerial fuel materials.
With carbon markets gaining importance, you can estimate how much carbon a forest stores.
The TreeMap dataset is being used for all these purposes.
The reason TreeMap came into existence isn’t what you might expect. In research, you might think that the end point of the journey is in sight when we embark, but that isn’t always the case, and that wasn’t the case here.

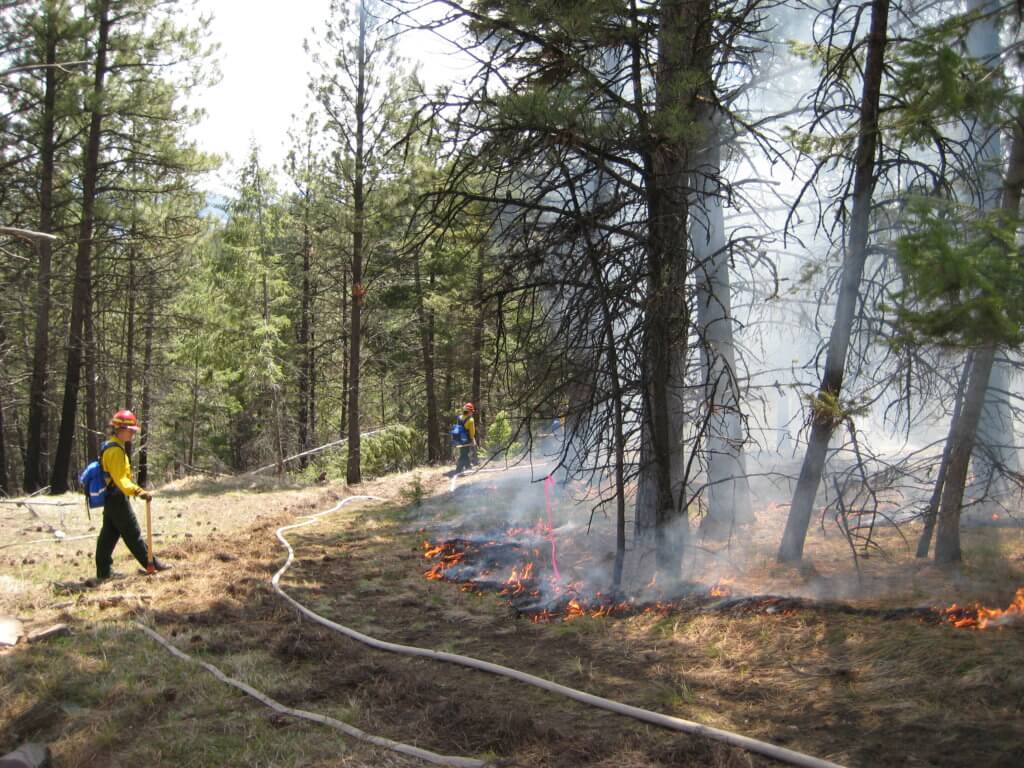
PHOTO BY KARIN RILEY
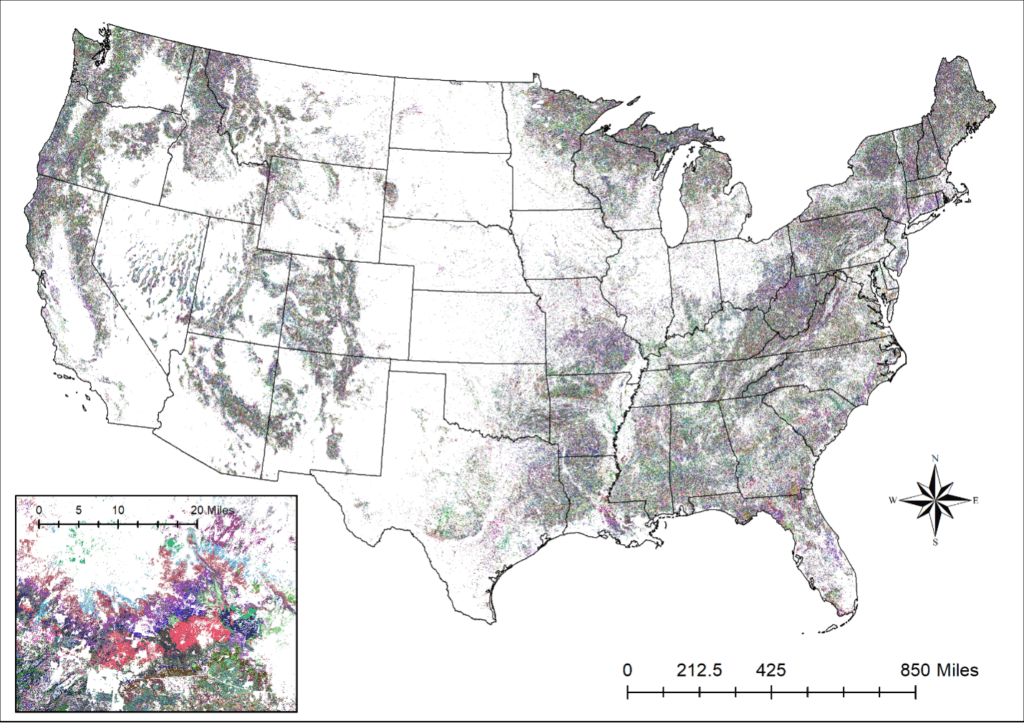
About a decade ago, I was working with a small group of researchers at the U.S. Forest Service’s Missoula Fire Sciences Lab looking for a way to calculate risk to forest carbon from wildfire. We had just completed fire simulations for the United States that gave us a detailed map of the likelihood of wildfire, and even the likelihood of burning at various flame lengths. But to use this tool to assess potential wildfire effects on forest carbon storage, we also needed a map showing tree-level detail of the forests. We could then use that map to estimate the amount of carbon stored in the trees, as well as how much carbon would be emitted by fires of various flame lengths. We expected a tree-level model of the forests of the United States would already exist, but after a thorough search we did not unearth one.
As fire scientists and not vegetation mappers, we were hesitant to create a map. Many other groups had already embarked on this daunting task. We were told that this task was too difficult, and we would fail. However, we had some different ideas about methods that might work, so we decided to approach the problem from a different angle than the others who were already working.
Fortunately, we did not have to start entirely from scratch as there are some areas on the landscape where the type of detailed tree-level information we needed (tree diameter, height, and species) was already recorded, notably at the locations of plots where the US Forest Service’s Forest Inventory Analysis (FIA) staff carefully measure every tree and sapling. During this process, staff also record the cause of death for trees that have perished, and recent disturbance history. However, only one of these plots is measured for every 6,000 acres of forest, meaning that for vast expanses of forest, very little is known.
To fill in those gaps, we looked to the LANDFIRE project which has mapped topography, bioclimate, vegetation (forest cover, height, and vegetation type), and recent disturbance on a grid for the entire United States, at 30x30m resolution.
Armed with those two datasets, we applied a machine-learning algorithm called random forests to match forest plots to pixels. The algorithm seemed to have an apt name for a forest-mapping project, but we soon learned that its name comes from the way it builds hundreds of decision trees to find interrelationships among the input variables (in our case, plot location, topography, bioclimatic variables like precipitation and temperature, vegetation cover, height, and type, as well as recent disturbance). Our computers churned for months, finding the best-matching plot for each of approximately 2.8 billion forested pixels in the United States. We then honed the method for several years, adding in recent disturbances including fire, insects, and disease. In 2018, we released the first product from this effort, a tree-level model of the forests of the western United States circa 2009. Subsequently we released two additional versions: one for the continental United States for c2014; and most recently a c2016 version for the continental United States.
These datasets can be downloaded from the US Department of Agriculture Research Data Archive. You’ll get a rather large raster dataset, and in the most recent version, an attribute table that has summarized information for each pixel on number of live and dead trees, forest type, biomass, volume, carbon and more. That means you can generate maps of those attributes at the click of a button. Additionally, you can click any pixel and generate a list of the trees.
Will TreeMap expand to other countries and continents? The methodology could be used anywhere there is a country-wide system of forest plots and maps of vegetation, topography, bioclimate, and disturbance.
With the major technical hurdles out of the way, we continue to refine the dataset. We are currently refining the species distributions and adding in better mapping of insect- and disease-affected areas. The use of random forests imputation technique has shown remarkable utility and we intend to continue improving and refining the TreeMap products to serve the needs of the Forest Service and other land management clients.
As we recently read in a meme (which is of course where one should look for wisdom), “Difficult things take a long time, impossible things a little longer.”
Links to datasets:
Western United States (c2009): https://doi.org/10.2737/RDS-2018-0003
Continental United States (c2014): https://www.fs.usda.gov/rds/archive/catalog/RDS-2019-0026
Continental United States (c2016): https://www.fs.usda.gov/rds/archive/Catalog/RDS-2021-0074
ABOUT THE AUTHORS
 Karin Riley is a research ecologist with the US Forest Service. Her current research focuses on better understanding the relationship between climate and wildfire, and how this relationship might shift with climate change.
 Mark Finney is a research forester with the US Forest Service. His Research involves wildland fire behavior, modeling of fire risk, and landscape fuel treatment.
 Isaac Grenfell is a statistician with the US Forest Service and has been working for or with it for 18 years. He is from Missoula, Montana, and earned his master’s degree at The University of Montana in mathematics. His work has touched on the landscape effects of wildfire as well as the probabilistic nature of the physical description of fire behavior.
